How controversial are today's newspapers?


Newspapers have always been around, and at some point in time were the main source of information.

Nowadays, in a world where we are submerged by personalized advertisements, where information
is at the tip of our hands, how is it possible for newspapers to draw our attention?

How can a newspaper which relates simple factoid attract more than another? What is the recipe
for success in this hundred-year industry? Well, we have an idea and will try to prove
our point through the following lines… will we make it? It is up to you to find out or not.

About

Controversy, as defined in the Merriam-Webster dictionary is a “discussion marked especially by the expression of opposing views”. As such, a topic that brings forth dispute and disagreement can be considered controversial, and by extension a newspaper prone to relating those kind of subject can be said to be controversial.

In this data story we will try to link the performance of a newspaper to the controversy of its published subjects. To do so, we analysed millions of quotes, from 2015 to 2020, which appeared in more than 150 millions English newspapers across the world.

The quotes were obtained from the Quotebank corpus which is the fruit of more than a decade of data collection. This Web-scale dataset provides a significant quantity of quotations, each of them being associated to its author and the journals in which it appeared along with many more features. An example of quotations that can be obtained is the following:

“I like Rob West, but not Robert West .” - Jimmy Kimmel


This example highlights what can be done with the dataset since multiple sources can be found for a single quote. By using this property we will be able to search for the occurrences of controversial quotes within newspapers.

Which topics to study?

The first step of our analysis is to extract relevant topics from the corpus. In fact, since we have to deal with Natural Language Processing (NLP), it is necessary to first preprocess the dataset. Therefore, the quotations need to be cleaned in order to get only their essence, i.e. words that represent the theme addressed by the speaker.


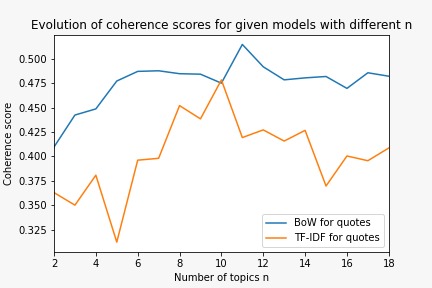
To carry this out, a Latent Dirichlet Allocation (LDA) model can be used either on the most frequent words through bag-of-words (BoW) model or on the most relevant words using the term frequency–inverse document frequency (TF-IDF) method.

A coherence score can be computed for each list of words in order to quantify how good the two methods are compared to each other. The LDA model then allows to separate the corpus into \(n\) different topics. By running it with different values of \(n\), as it is shown in the figure, we can see that there is an optimal number of topics.

This number can then be kept for further computations.


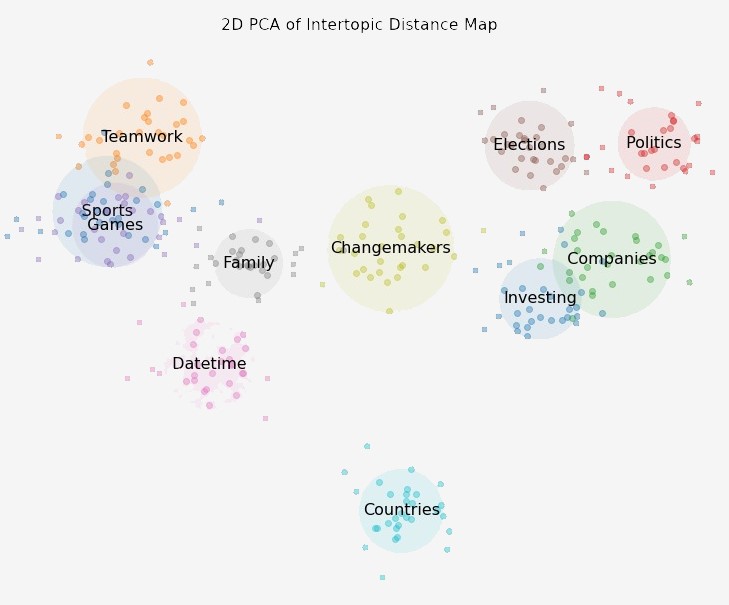
By fixing the number of topics, the LDA model can then be used to extract the most relevant terms for each topic.

Next, a word which represents best each topic was chosen by using the list of most relevant terms in each topic. This resulted in the right-hand side graphic, with visual representation of the cluster (i.e. topic) formed by those words.

It can be noted that by mapping the intertopic distance we can visually see how close two topics are to each other.

You can play with an interactive version of the figure below, which shows the top 10 most relevant words for each topic. By selecting a topic number, the probability to encounter its top 10 associated words in the corpus is given along with an estimate of the number of times they are linked to the topic.

For the rest of our analysis we can choose those words to form a set of sub-topics that allows to have more meaningful representation of each topic.


The following table summarizes the chosen topics and their associated number:

1 2 3 4 5 6 7 8 9 10 11
Topic Sports Teamwork Companies Politics Games Elections Datetime Family Changemakers Countries Investing

How to measure controversy?


Controversy score with sentiment analysis

For each selected topic we want to calculate a sentiment score to assess how controversial it is. A sentiment analysis can be done on all quotes linked to the sub-topics defined in the previous step.

The sentiment analysis allows us to define if a quote is addressed in a positive or negative manner. We ended up with a repartition of positive and negative sentiments for a given word.

From this distribution, we defined a controversy score as follows: a subject with an equal repartition of positive/negative sentiment should be interpreted as strongly controversial.

The following formula was implemented to define the score: \(2 \cdot \frac{min(\#pos, \#neg)}{\#pos + \#neg}\).

As we can see from the figure below the theme “Politic” is more controversial (controversy_score = 0.98) whereas “Team” does not reflect a strong controversy (controversy_score = 0.54).


We took some time to analyse the term Trump, which obviously represents the well known former President of the United States, Donald J. Trump.

Regarding all the drama around the character, the word Trump had to be a controversial topic! So we looked at how its controversy score evolved over time.

The score is at its peak in the year 2015, when he was running for President and had the reputation of being a successful businessman with the tendency to speak very frankly on Twitter.

But, after his election his status changed radically since he became one of the most powerful people in the world.

In some way, his communication might have become wiser. However, the number of articles citing him increased and the controversy score of his name stayed around 80%!


Signature score

To assess the correctness of our controversy score, we have compared it to methods available from literature. In particular we compared it to a method based on the variance of sentiments from the paper “Quantifying controversy in social media”.

We also considered a method that compares sentiment distributions within quotations. Additionally, this “sentiment signature” based method aims at providing a relative controversy score to attempt to validate our model.

To validate or discard our model, we applied a principle of majority vote. Our expectation was that the two methods that “agreed” the most often should be more accurate and closer to the ground truth. In the figure above, we have the similarity scores of the three different methods we considered. Essentially, it can be seen from the cells colors how similar one method is to another for a given topic. Doing this pairwise comparison, we got that the mean similarity score (across all topics) is highest (i.e. 0.52) between our method and the sentiment signature based one. One can remark that this analysis provides us with arguments against the variance-based method.

As a conclusion, we will rely on our method for the aforementioned reasons and also for the fact that it is simpler and provides an absolute measure of controversy.


Controversy score for each topic

Finally, after checking our model, it was time to evaluate the controversy score of the selected topics.

The controversy scores was calculated by summing all the positives and negatives sentiments over all sub-topics. Here, it was done over a 5-year period, from 2015 to 2020, see graphic below.

First, it can be observed that our scores are consistent over the years and specific to each topic (they are not all packed together). In addition, some topics, such as “Politics”, “Investing” or even “Countries”, seem strongly controversial as they are usually perceived within popular opinion.

In opposition to the terms like “Sports”, “Datetime” and “Games” do not seem to represent controversial subjects, as sport journalists are supposed to stay neutral in their report.

How to select newspapers?


Newspapers in the dataset

As the title of this story implies, one of our purposes was to see how controversial newspapers are. As such, it was necessary to select some newspapers to see if their performances were related to the usage of controversial topics.

An initial idea was to select the 10 newspapers with the most appearances in the dataset, however as you will see, it quickly showed unreasonable.

Assuming that a sample of 100’000 quotes might be representative of the dataset. We could extract the distribution of the newspapers over this subset, the results being presented on the histogram. Note that the first journal “news” is actually a newspaper called “news” in Australia.

Those results were not as predicted, we expected to mainly find big names of the industry but it seemed that smaller newspapers were publishing more. They might have tried to overcome the lack of qualitative publications by their number of articles.

It was necessary to check if we were able to access a performance indicator, for example the sales over the last decade, otherwise the selection of the newspapers had to be done using the later criterion.


Newspapers’ sales data

The sales data for the aforementioned newspapers were not available. So instead, we checked for which newspapers the sales data could be obtained and then investigated those newspapers presence in our dataset.

Several English newspapers, present in our dataset, had accessible sales data. Therefore, we focused our analysis on those journals. You can see below the evolution of their sales data over the years.

ID Newspaper Nationality Foundation year Domain of expertise
metro Metro UK 1999 news, sport, entertainment
thesun The Sun UK 1964 news, sport, celebrity, showbiz, politics, business
dailymail Daily Mail UK 1896 breaking news, showbiz, celebrity, sport news, rumours, viral
standard Evening Standard UK 1827 London news, business, sport, celebrity, entertainment
mirror The Daily Mirror UK 1903 news, sport, celebrity gossip, TV, politics, lifestyle
thetimes The Times UK 1785 sport, celebrity
telegraph The Daily Telegraph UK 1855 news, business, sport, lifestyle, culture
dailystar The Daily star UK 1978 breaking news, celebrity
express Daily Express UK 1900 news, showbiz, sport, lifestyle
inews i UK 2010 news analysis and breaking news, business, politics
ft Financial Times UK 1888 world news, economy, finance,
theguardian The Guardian< UK 1821 world news, sports, business, opinion, analysis, reviews
dailyrecord Daily Record UK 1895 news, sport, politics, celebrity, gossip
cityam City A.M. UK 2005 business, finance, economy, politics

Analysing controversy through quotations


Finding the quotes within selected newspapers

Subsequently, we extracted all quotes cited in those newspapers from the subset of 100’000 quotations for each year.

Secondly, to link a topic to a quote we looked if the quote contained one of the sub-topics. This resulted in a matrix where we could find the number of occurrence of each topic for the different newspapers.

The distributions of the quotes over the topics were normalized by the total number of quotes by newspaper. From the heatmap below, one can observe that all newspapers are focused on mainstream topics such as “Sports” or “Teamwork”. It can also be noted that the topic “Investing” has a higher chance to appear in one article of the newspaper Financial Times than in another one, this makes sense as the newspaper is specialized in this field.


Measuring newspapers controversy


Finally, by multiplying the topic-newspapers matrix with the controversy score vector for each topic, we got the controversy score of each journal.

The process was applied for each year of the period individually, this resulted in the controversy score evolution of each newspaper over time. The resulting graphic is presented below.

Looking at the sales table one can observe that they are decreasing over the years, however the controversy score seems to react in an opposite manner. Is it a reaction of the newspaper companies, which are willing to keep their numbers as high as possible and are willing to modify their usual topics to do so? In 2020, all newspapers seem to have talked less on controversial subjects, one can explain this behaviour by the pandemic which was taking all the spotlight.

One newspaper clearly stands out from the others, FT which stands for Financial Times. It is the most controversial newspaper and its controversy score is continuously increasing until it suddenly dropped in 2020. We, first, tried to explain this behaviour with the fact that the pandemic completely stopped the global economy in 2020. It generated a consensus regarding the financial market. However, as good ADAventurers that we are, we took a closer look at the data and quickly realized that for this year an abnormally small amount of quotations were selected in the dataset. This value was neglected for subsequent calculations.


On the graphics below you can see how newspapers sellings are related to their controversy score. On the left the results for all newspapers and on the right you can scroll through the graphics to have a better view of each newspaper separately.

Discussing the results

Relayed topics in the press

By analysing the most important newspapers sellers in the UK, we have seen that the most relayed topics are the sports and team related ones. This underlines a huge interest for sports in the UK, and may explain why sports’ players have such a high salary, which is because people pay to watch matches and read results.
Also, by looking at the most important relayed topics, it can be seen that they vary from “Sports” to “Investing”, passing by “Changemakers”, and “Family” related topics. One very interesting subject that is not straightforward to understand is the reason why “Datetime” appears to be a famous topic in the news. One reason could be that date is always cited in speeches by citing past facts to explain and try to get its audience to adhere to their opinion .

As explained at the beginning, our goal was to see if we would be able to link the performance of a newspaper, here economic performance (sellings), to the usage of controversial subjects. In order to correlate the latter’s we performed a linear regression, the results can be observed above.
Well, the results did not fit our expectations. The expected results were a clear and direct correlation between sellings and the usage of controversy, here represented by our controversy score. One can observe that sellings do not increase with the controversy score, it is rather the opposite! There is a small decrease in sales for 11 out of 14 newspapers!

What can we take away from all of this?

Well, the results of the controversy score of a single topic are not too bad, the sub-topic “Trump” reacted to the numerous scandals that occurred during the year 2017. However, our controversy score does not really behave as the signature score already defined in the literature but the implementation of ours was easier.

The distribution of the topic for each newspaper represents correctly the most recurrent themes in the media and their area of expertise. As a final point, we do not get the expected results, but we can suggest that the usage of controversy does not increase sellings, perhaps even the opposite.

To finish with, we have dug into one of the most important features to explain sellings which is how newspapers choose to relay daily information. However, the controversy of each newspaper is not the only parameter that affects sellings. In fact, we could think of public opinon regarding daily information, perhaps because people are not willing to follow daily news, which would result in a drop in sellings.

Another factor could be that today people can access news through YouTube videos, social media or other kind of media outlet. Even though these previous factors seem to influence negatively newspapers’ sellings, population growth attenuates this decrease. Thus, all these variables have a certain impact on sellings, so it is hard to draw a significant conclusion if, whether or not, relaying controversial news impact sellings positively or negatively.

Our Team

...
Fadel Mamar

MSc Computational Science Engineering

...
Yannick Neypatraiky

MSc Civil
Engineering

...
Arthur Chuat

MSc Energy Science
& Technology

...
Paul Habert

MSc Management Technology & Entrepreneurship